
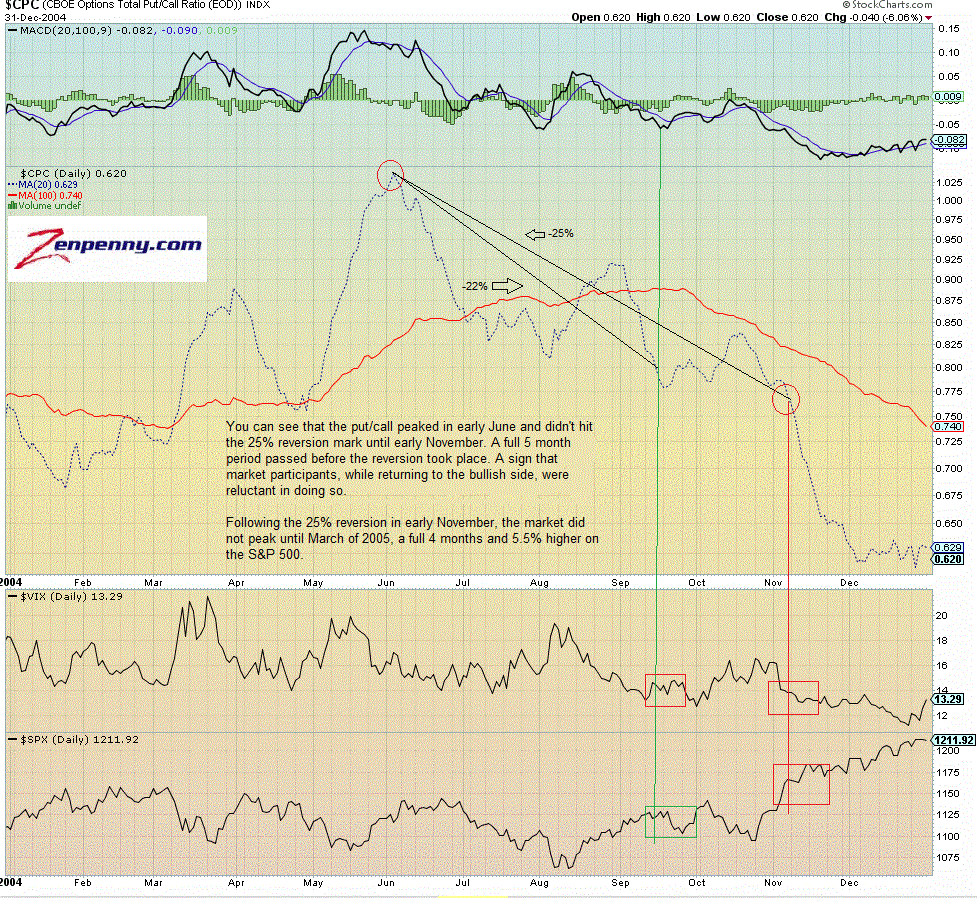
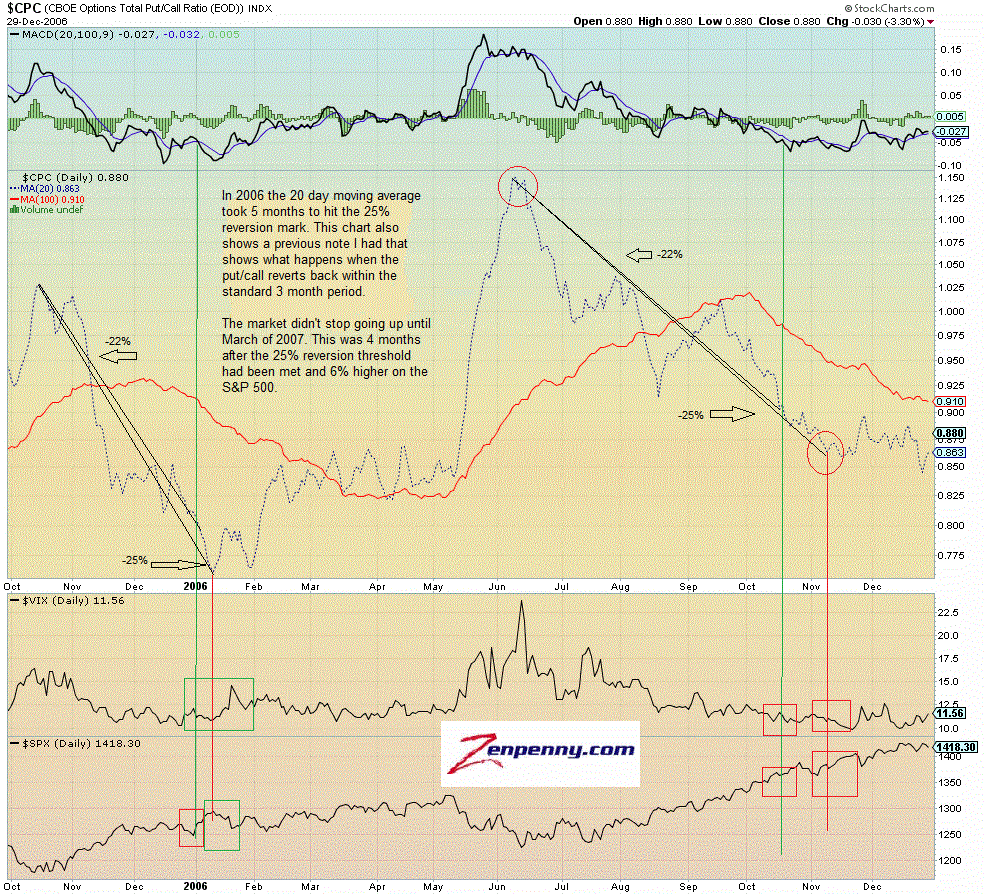
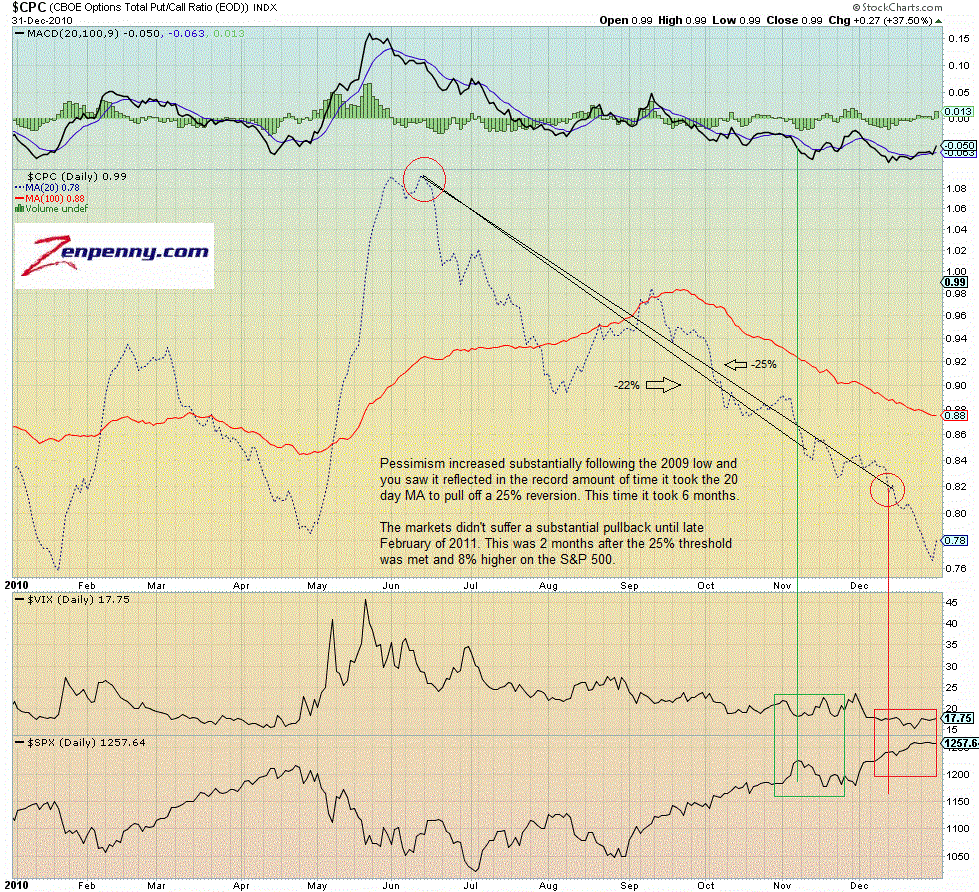
The following is the aftermath of the last three incidences of the 20 day moving average of the put/call ratio pulling back 25% from its highs after an abnormally long period of time.
In my research, it typically takes 2-3 months for market participants to go from fear driven, excessive put buying to warm and fuzzy call buying. There are rare instances when it takes longer than 3 months. This typically signifies that there is an excess amount of skepticism in the marketplace, as call buyers are reluctant to return to the marketplace. I outlined this study in detail this past week.
There have been three instances of a prolonged reversion (longer than 3 months) of the 20 day moving average taking place over the past decade: 2004, 2006 and 2010. I bring this up because we are on the verge of meeting the 25% threshold currently over a prolonged period (longer than 3 months) of time. What can we expect out of the current market now that call buyers have returned?
Here are the charts from each of the three incidences over the past decade:
click chart to enlarge

2004-2005

2006-2007

2010-2011
If this study holds correct, then we can expect a top to approach around the April-May time frame, with the Dow seeing 13,000 and the S&P 1350 before all is said and done.


