HOW THE CURRENT MARKET PICTURE STACKS UP AGAINST THE CURRENT SENTIMENT PICTURE
Given the state of information indigestion that is prevalent in today's financial world, it is only proper that I begin this with a little bit of history. History in this case is a little over one month ago. It was at that time I posted an article titled, "Using The Put/Call Ratio To Forecast 5% Correction." The conclusion that was reached as a result of observing the put/call ratio on March 30th was that the stock market was, at a minimum, one month away from a correction of any substance.
Sentiment, however, is but one tool in an investor or trader's arsenal of weapons. It must be used selectively based on the nature of the market at any given time. You can always sniff out an inexperienced investor by the level of importance they place on sentiment data alone. Often times an entire investment thesis and resulting portfolio structure will be based on one or a number of sentiment driven indicators without regard for anything else. A boiling pot of impending disappointment that sends the sentiment driven investor back to the drawing board eventually.
Tonight we will look at two sides of the equation. First let's see what market action is telling us here. I'll go over these points in living color during this coming weekend's review:
- The Dow Transports, arguably THE leader of the current rally, are exhibiting increasingly sloppy behavior, threatening to move below a key technical point.
- Dow Industrials today thrust off of the key trajectory for 2013 pictured here. This is an indication that the market is growing uncomfortable with the slope of the current move.
- IWM volume today was the greatest for a down day since September of 2011. It is not just the volume on a down day that is of concern. Perhaps more importantly, it is where that volume surge is occurring. In the case of IWM (Russell 2000) it is occurring right at the key trajectory from the October 2002 lows pictured here. A very significant development indicating that the market is recognizing the importance of a failure at this key trajectory.
- The SOX is threatening to fail right at its key trajectory from the 1998 lows for the index.
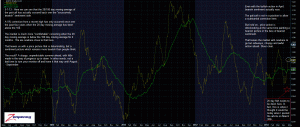
Now let's look at sentiment by looking over the combined put/call ratio using the 20 and 100 day moving averages only:
click chart to enlarge
If you are confused, then you are right where you should be. The market will also be confused, most likely resulting in choppy sideways action that leads both bulls and bears nowhere throughout the summer months.
In this case, the preferred position is leaning towards an abundance of cash and tendency towards mobility.


