CASE CLOSED: THE DOW ENDS 2012 NEAR 13,500
A step by step study of how I arrive at this conclusion follows:
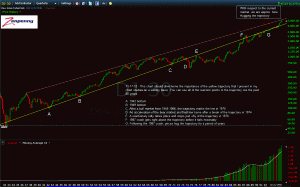
On October 24th, I presented a study titled "How 1987-1992 May Present The Holy Grail For The Market." It is not your traditional correlation study simply providing an overlay of current prices with prices from a similar period. This study looks into how the market of present day is reacting so similarly to an identical trajectory. In order to give you a better understanding of the trajectory, I first want to show a quarterly chart of the Dow going back to the 1932 bottom during The Great Depression:
click chart to enlarge
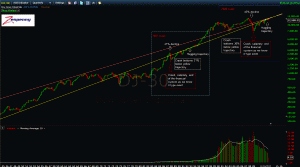
It is obvious the tremendous amount of influence this trajectory exerts over the market. The question becomes how does this study relate to present day. Let's first take a look at the exact same trajectory and the stunning similarities between the 1987 and 2008 declines in relation to the trajectory:
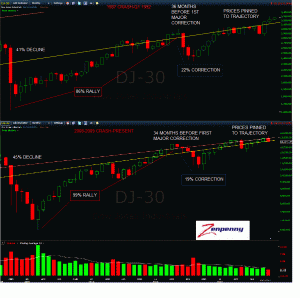
The similarities in calamitous events have been remarkable thus far, as has been the recovery since. Here is a closer look at the behavior of the current market versus 1987:
Now for the money shot. If this study should continue to provide the road map to the current market based on the relation to the trajectory, we know the following:
1. There will be very little downside volatility in the months and years ahead.
2. There will be very little upside volatility in the months and years ahead.
3. The market will be in a very slow and arduous bull market in the years ahead that feels like it is prone to collapse at any moment. Sound familiar? We're already seeing that honey.
4. Declines of any more than 5% should be bought hand over fist. We are currently at a 7.5% decline from the recent peak.
5. This entire decade will not see a bear market. Only corrections within a bull market.
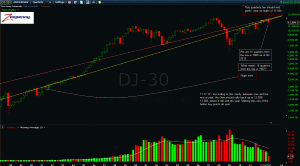
Where are we in relation to the 1987-1995 period? Here is your road map. Treat it with the respect it deserves:
Let me clear my throat............case closed.


