MEASURING THE VELOCITY OF FEAR DELIVERS A CURIOUS MESSAGE
By traditional standards it has become accepted practice to look at the wide variety of sentiment based indicators that exist, designate a number based on historical relevance that tells of optimistic or pessimistic feelings and then attempt to construe whether a market should bought or sold. While this may seem like a potentially profitable practice, I am here to tell you that it only gives you a slight edge. Possibly no edge at all given that we are all now contrarians and we are all looking at the same data to develop contrarian-based ideas about the market.
I am here to tell you that the competent investor seeking a greater edge must delve deeper. You can't simply look at arbitrary statistics and deem that it is time to buy or sell. Tear those statistics apart by finding new, innovate ways of measuring them. I attempted to that with my series titled "A Fascinating Interpretation of the Put/Call Ratio: Volume 1" posted in January. And followed up with a couple more ways of interpreting the put/call. If you read the articles, you will see how spot on the studies proved to be. On January 14th, I proclaimed the following as a result of my findings from these studies:
If this study holds correct, then we can expect a top to approach around the April-May time frame, with the Dow seeing 13,000 and the S&P 1350 before all is said and done.
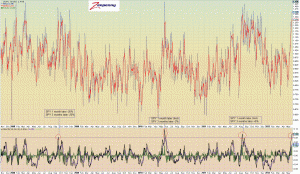
Tonight I decided to reveal another study given the crucial space in time we are currently in with relation to the financial markets and the macro-events that are influencing the day to day volatility. In this study, I looked at the influence that a parabolic rise in pessimism as measured by the put/call ratio has on the markets over a 1 month and 3 month time frame. I am using the 2 day and 5 day moving averages of the combined put/call ratio for the data and MACD to measure the velocity of the increase.
Over the past week we have experienced an extremely rare event. So rare that it has only taken place 3 times prior to now over the past 5 years. That event is a rise in pessimism that has so much velocity behind it that it drives the MACD reading on the 2/5 day put/call ratio over .08.
In the chart that follows, I measured where the S&P 500 was 1 month and 3 months after such an event. A small sample size here doesn't take away from its significance:
click chart to enlarge
While I do believe that we will be significantly higher than we are now by years end, I believe that move will be condensed between September/October-December. Between now and then there will be nonsensical volatility that should only be tolerated in a minimalistic manner. That means reserves of cash. No margin. No excessive churning or trading. Simply wait for the opportunities to fall into your lap as they will.
Over my career beginning in the mid-90s, I have always made the most money for myself and clients by allowing opportunities to come to me and not forcing the issue. You can make tremendous gains in a very short amount of time if you are patient. The second half of 2012 will be proof positive of this fact. Over the next few months, you will be wasting your time in attempting to tame this beast. It is almost summer, the news will be heavy and the trading thin. The variables are too many and the resulting conditions too unpredictable.
My intermediate term indicator is about to flip to 50% cash. I will humbly bow my head and follow its lead. I am still up nicely for the year and plan on preserving those gains in order to turbocharge them in the 4th quarter. Until then I will patiently wait.


