A FASCINATING INTERPRETATION OF THE PUT/CALL RATIO: VOLUME 3
Misinterpretations of sentiment indicators are common in today's market. Traders have become accustomed to looking at raw data for these indicators, without any respect for historical reference. The put/call ratios can be extremely effective if smoothed out and viewed from a relative basis. You do that by using moving averages instead of raw data and zooming out.
Today we take a look at the equity put/call ratio. Traders like to refer to this as a "dumb money" indicator. This comes from the idea that smaller, retail investors enjoy getting involved in equity options and professionals tend to gravitate towards index options.
I am not sure that there is a "dumb money" class left in this market. When even the small pockets of retail investors have a general grasp of contrarian theory, the act of fading the next guy becomes an exercise in futility. It's like the story of a hedge fund manager that goes to an investment conference and the first question the presenter asks, "How many of you in this room are contrarians?" 80% of the attendees raise their hands.
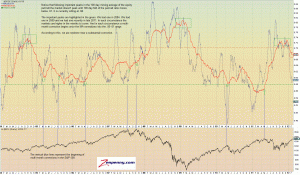
The chart below displays the 20 day and 100 day moving average of the equity put/call ratio only. The bottom graph displays the S&P 500. I have marked important, multi-month tops with the vertical blue lines. You can see that there seem to be some definite requirements of where the 100 day moving average needs to go before important tops in the market are observed. This becomes all the more pronounced following periods of excess pessimism that are marked by important tops in the 100 day moving average of the equity put/call. I have highlighted those tops with a green box.
The conclusion here is that the bears may have a lot more waiting to do before a top of any significance is observed.
click chart to enlarge

